It may be counter intuitive to start statistical analysis on a dataset that hasn’t been fully vetted, but that is exactly what can be done for environmental contaminant datasets. If you can QA-QC them, great. If not, dive right in and start analyzing them.
At Chemistry Matters, we are routinely passed datasets from other sources for our interpretation and analysis. Sometimes these data sets are in PDF format and other times they're in Excel.
We need to assume that the data is correct, but is it? How do you know? We are rarely given the time (and budget) to double check that data presented to us matches the original laboratory reports. Obviously, it would be nice to be able to check that all data is correct, but in most instances, this is not feasible as it is likely cost prohibitive. Especially if dealing with large datasets and having to go all the way back to laboratory reports for verification.
Can you start statistical interpretation on data that has errors?
Is this a problem? It can be. But it doesn’t need to stop the interpretation.
One of the things that we have learned over the years is that one of the best ways to find erroneous results is to actually jump right in with the data and start analyzing it. Erroneous data can stick out like a sore thumb in analyses such as principal component analysis.
Here is one example where we were examining routine metals and salinity in groundwater monitoring data. We were examining the fingerprints of the cations and anions in the groundwater results using principal component analysis (PCA).
PCA analysis can find errors for you
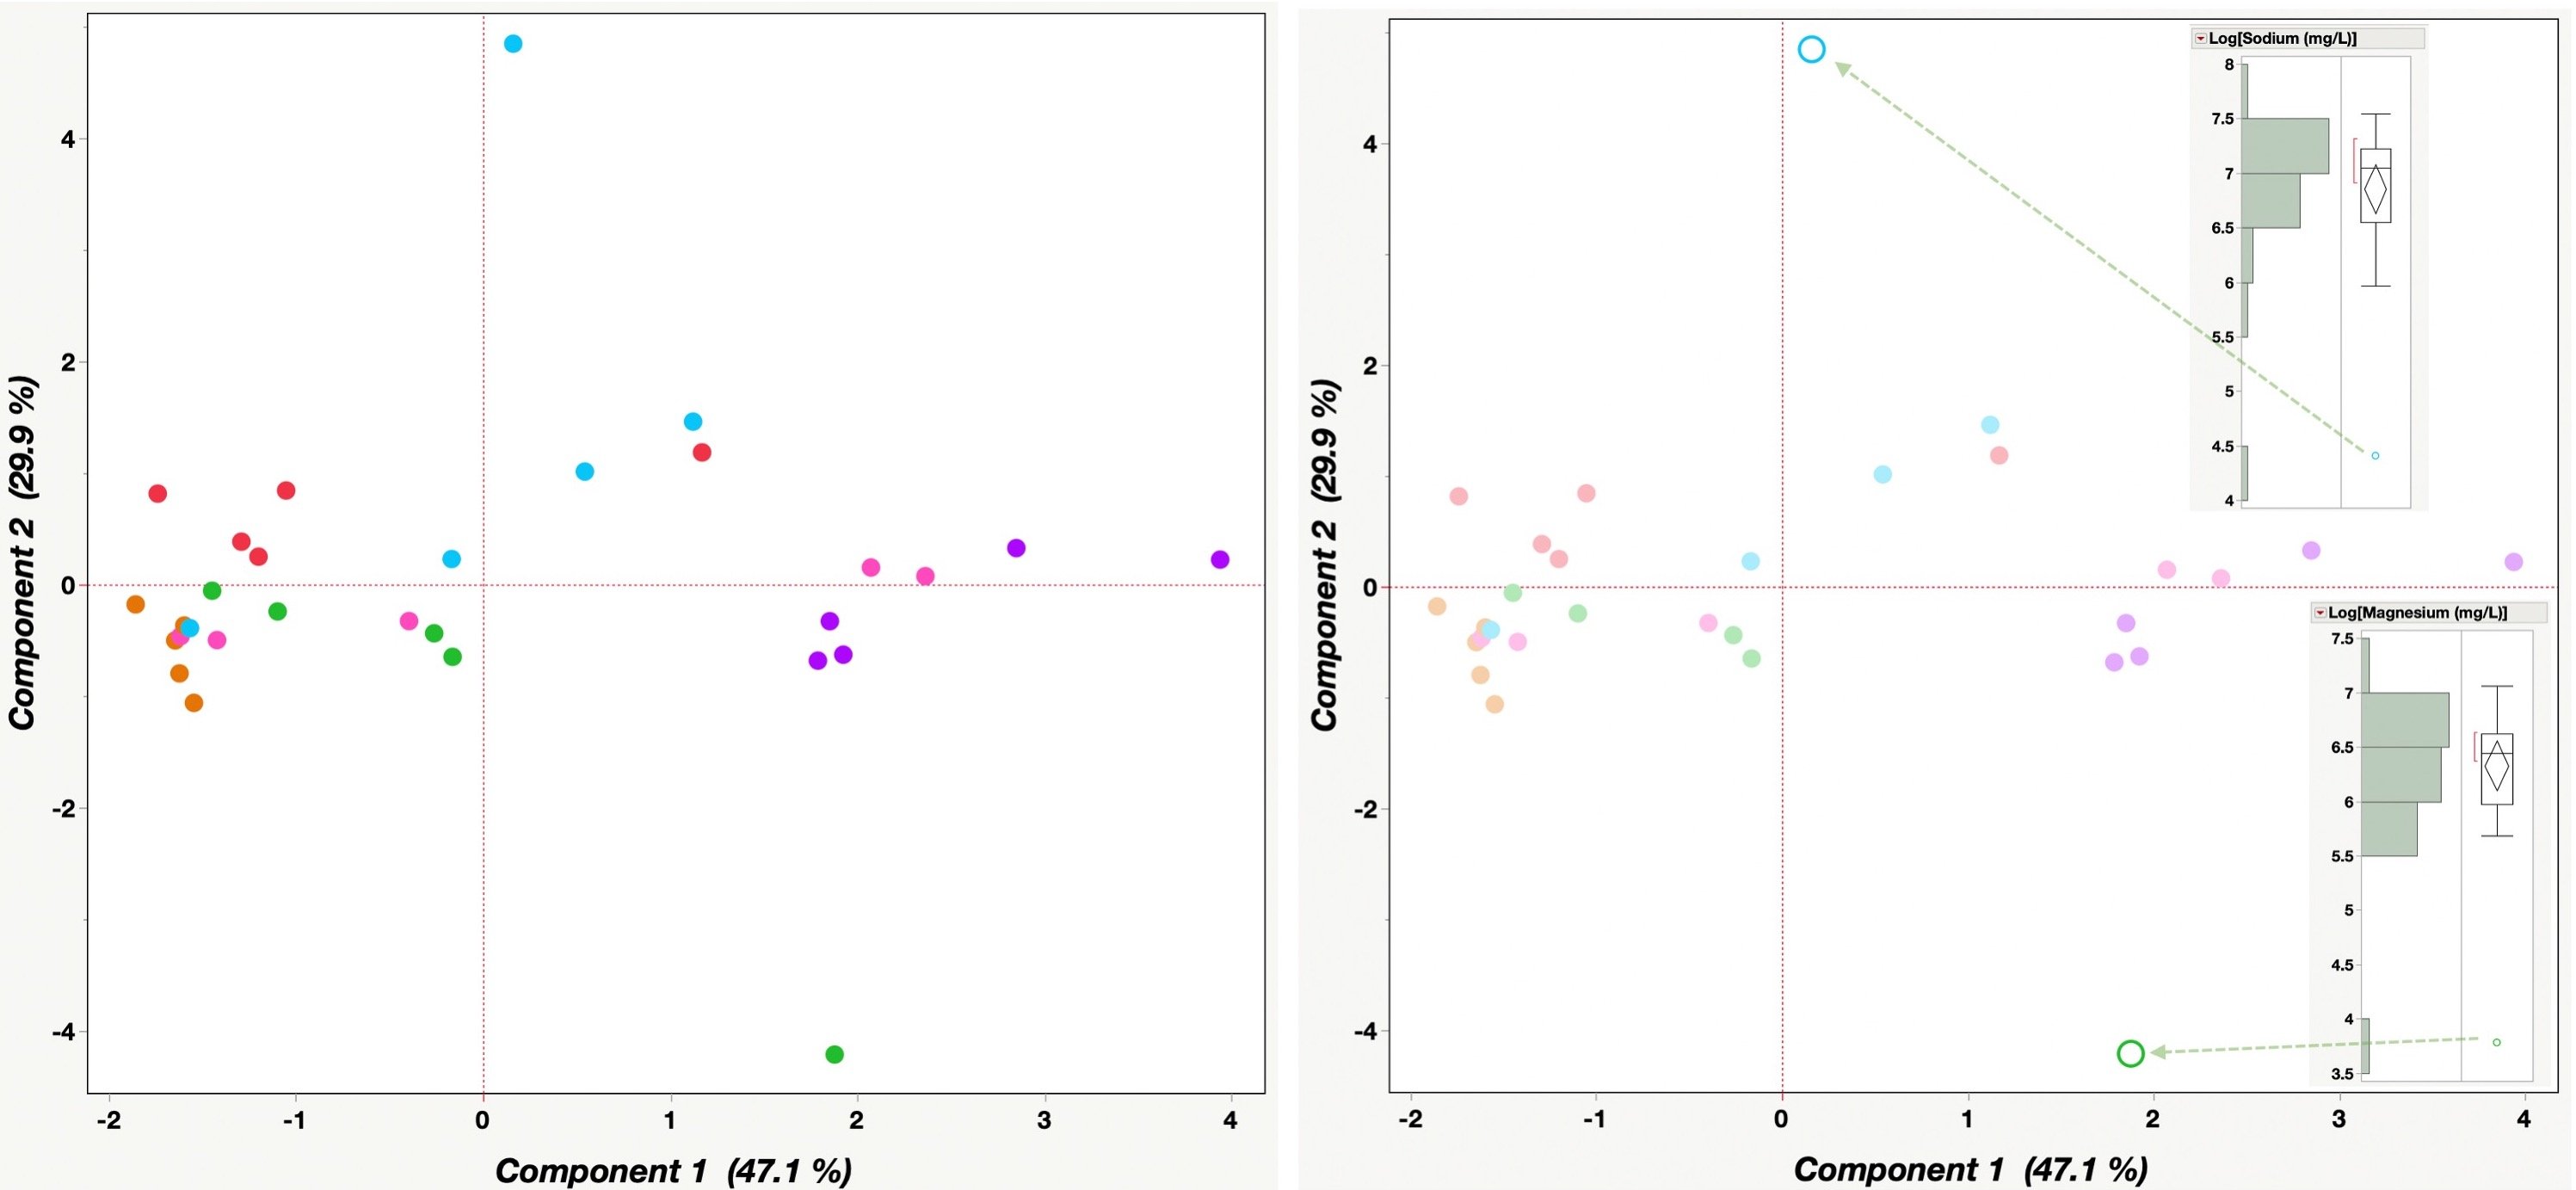
PCA analyzes the variance of the dataset (in this case the fingerprint) and samples should group together when they have similar patterns. As shown in the figure, we have two samples that are not fitting with the rest (two of these are not like the others – insert Sesame street song here, anyone else from that era?). Each colour represents a groundwater monitoring result and each dot of that colour represents a different sampling date. The graphic shows that these two points are not plotting near other sampling times from those same wells. Something is amiss!
Another way to visual these results is using radar plots of the cations and anions, something we like to call salt print - fingerprint of the salt. As seen in the GIF below, all the samples show very consistent patterns except this two bad data points.
Although many people like to think so, Chemistry is not magic. Chemistry follows very strict laws. Things just can’t disappear or appear out of nowhere. If something looks wrong, it probably is.
There are two possibilities to explain these weird points. Either each of these groundwater results actually changed and were only like that for a single sampling event or there is something wrong with the data. Either option provides insight into the data. These points were thus examined further to figure out what was going on.
By looking at the distribution of the data, we can see that both points are abnormally low. A low outlier is very difficult to detect and rationalize. Both these data points had values for two different parameters that were 10x lower than all other values for the entire dataset. What are the odds of that? Not very likely! Orders of magnitude errors are some of the most common errors for transcribed datasets. The other one being measurement units (mg/kg instead of ug/kg, for example), which is usually three orders of magnitude difference.
The PCA very easily identified these erroneous data points. PCA examines the variability of the data and something with 10x difference in this data set provides a lot of variability. Therefore, these points pull away and are isolated from the rest of the data in this type of analysis.
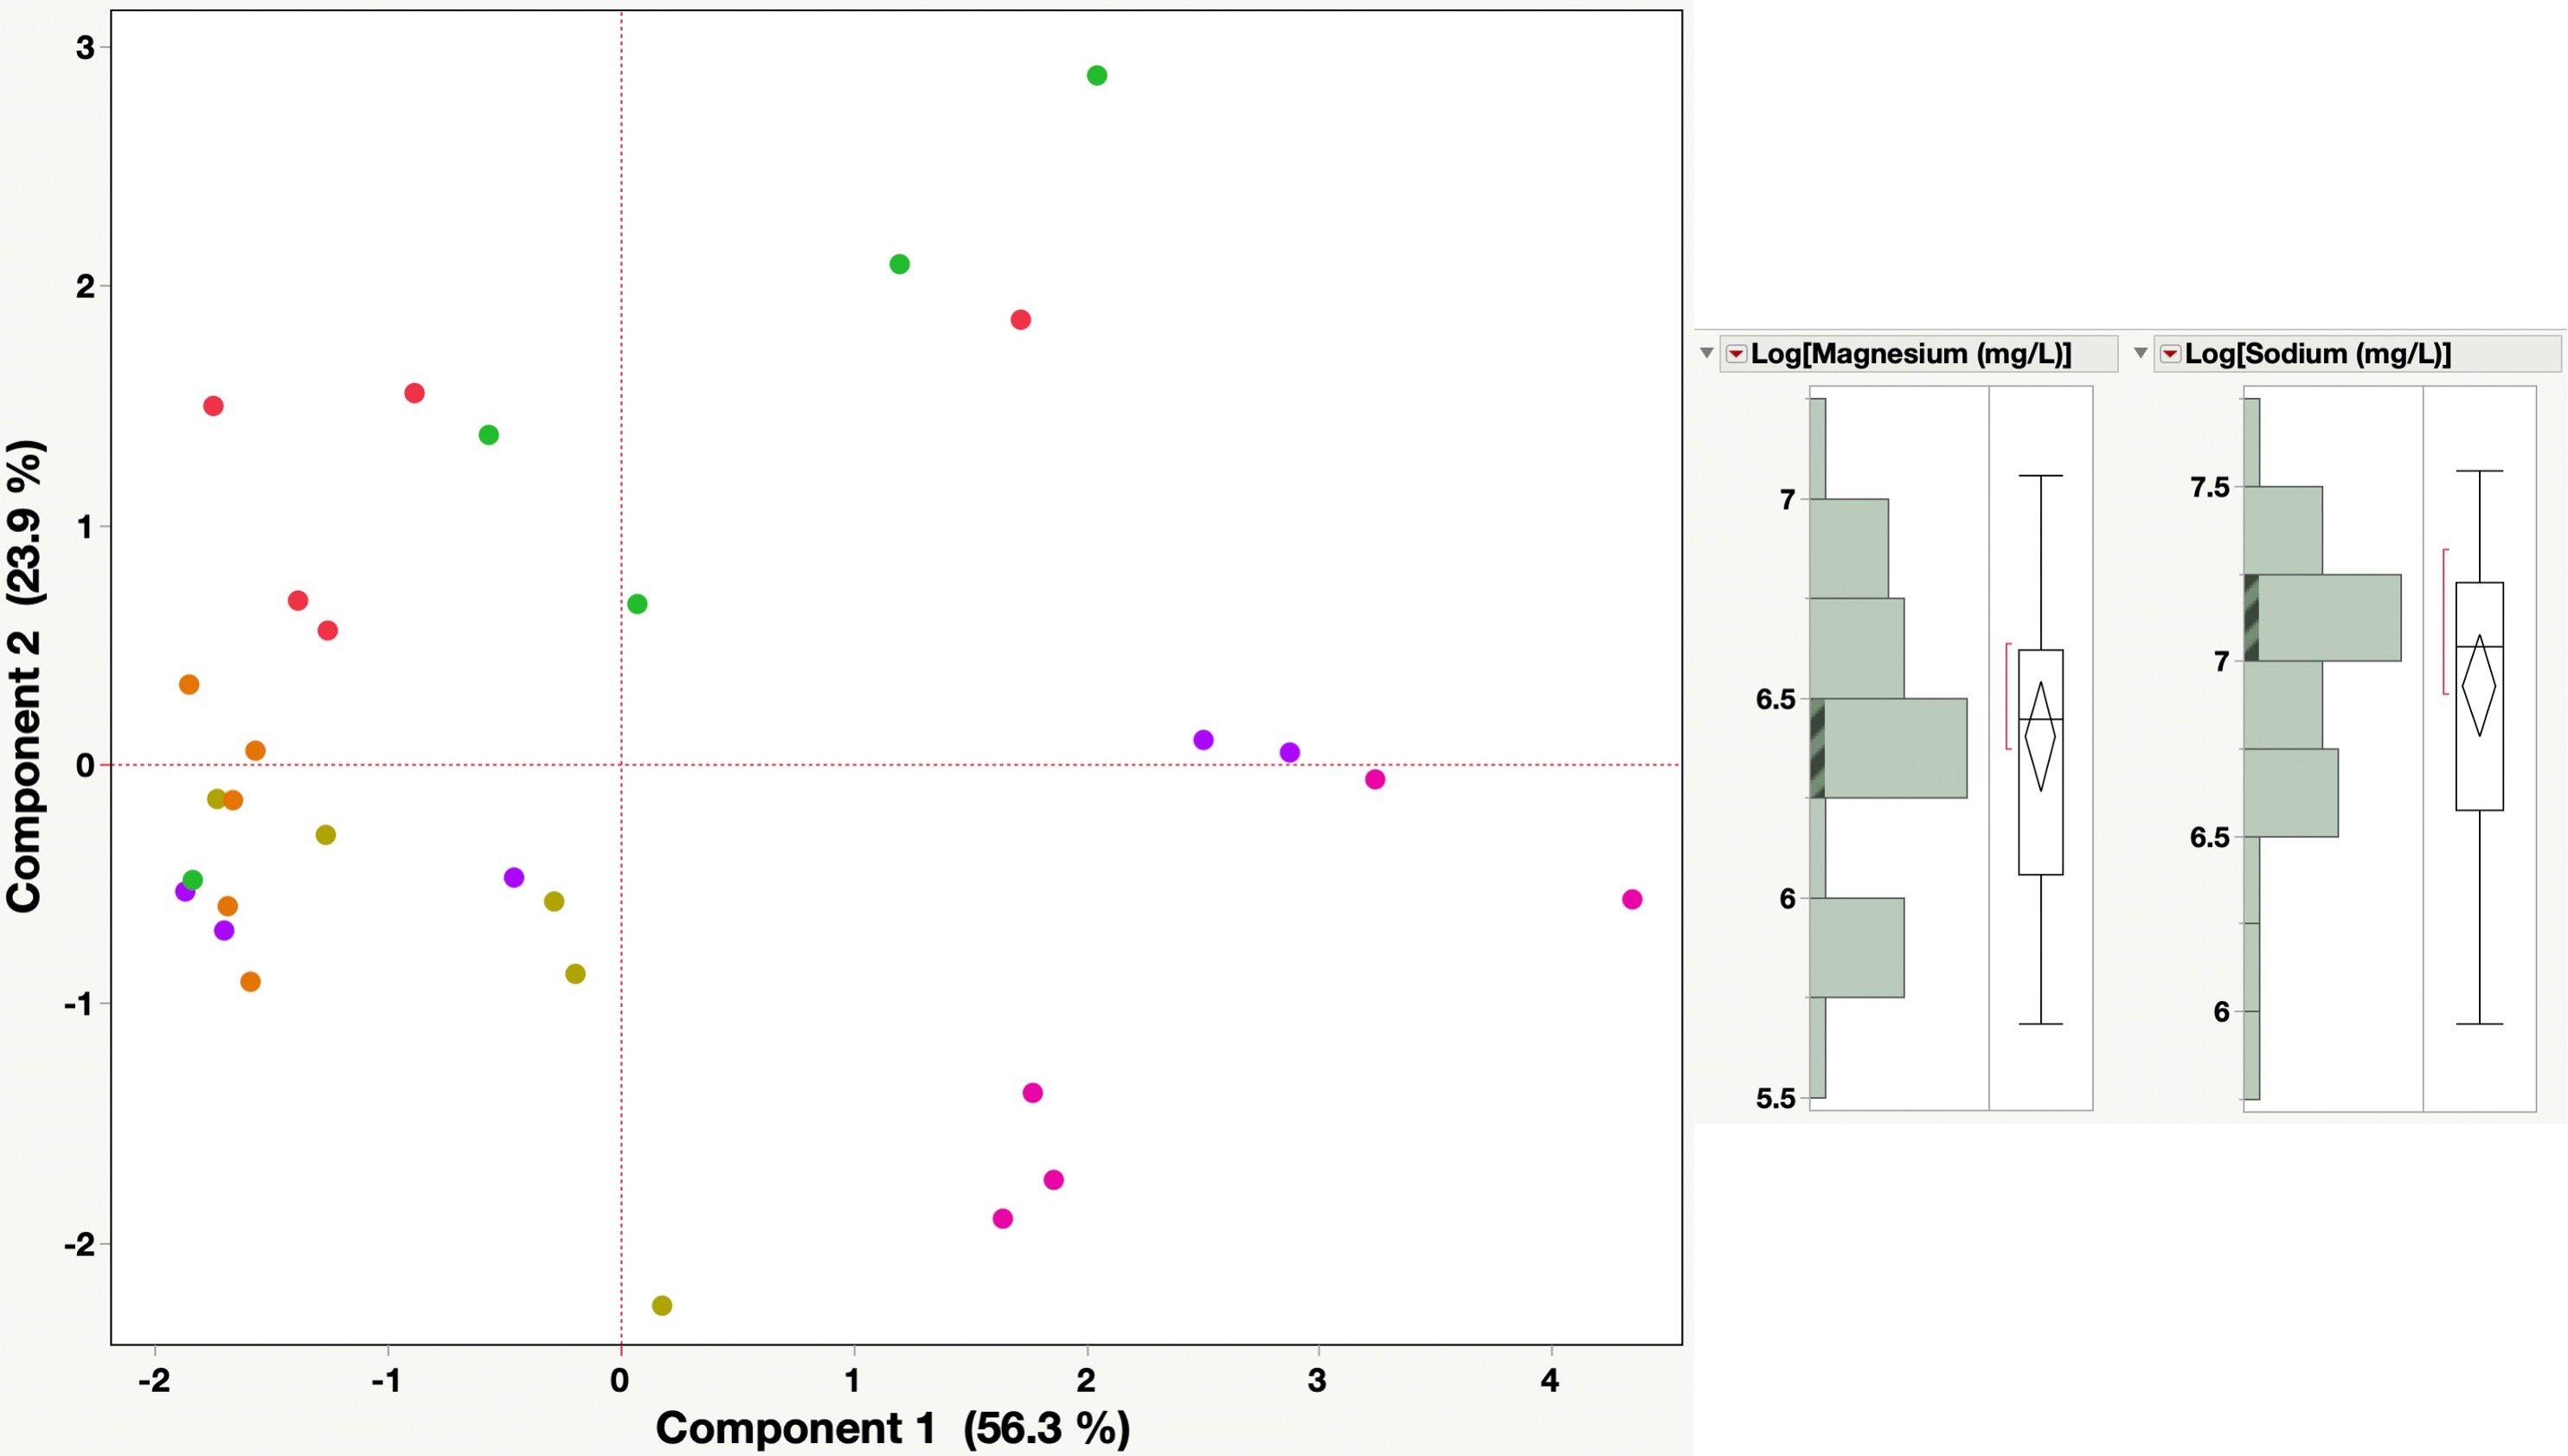
Once the transcription error was fixed for these two parameters, the PCA plot looked the way it should, and you can see that the distribution of the data is a lot better as well. We could then get on with our analysis and interpretation of the results.
There are couple of learnings from this analysis.
- If you start working with your data, you will likely find erroneous data and outliers.
- Chase down the weird data points and figure out what is causing them. It will either tell you more about your site OR you will figure out what is wrong with the data
- Trust in instincts. If something looks wrong, it likely is. Chemistry should be conserved for your samples (there is a law about that!).
If you have any questions about statistical analysis of environmental data or have chemistry questions about your data that is not making sense, give us a shout!


