Models and modelling, I was never a big fan. I always thought that you could make models say whatever you want them to say. But, many years later, I have changed my tune, particularly for statistical models. Used right, models can provide convincing lines of evidence that you have the correct answer to your scientific dilemma. Now, these models provide valuable insight for many of Chemistry Matters projects. These models are applied to very fundamental projects such as data from groundwater monitoring programs to sophisticated models for source allocation of persistent organic contaminants in sediments.
Just like me in the past, many people do not trust models. How do you gain the model doubters trust? Here are three things I could think of:
- As always, for interpretation of data or models, crap in equals crap out. You need good data and you have to make sure your data is clean. This does not mean removing data points you don’t like. It means making sure the data is correct. As chemists, that is easy for us to do. Review the data, the lab reports, do the QA-QC checks, and make sure the data makes scientific sense. Next, it is time to deal with missing values and non-detects. We impute both. Yes, they are made up numbers. Took me a look time to get my head around this too. Make sure to mark these numbers so you don’t accidentally quote them as real concentration values but for modelling, it is always best to have a square data set so everything has a value. For non-detects, we impute the replacement value using Kaplan-Meier method. Left censored data is common in environmental world and repeating numbers (1/2 detection limit for example) are not the best for models and analysis. See Dr. Helsel’s webpage and take his courses for more information on imputing left censored datasets. Cleaning the data is step one. If you are presenting these models to others, make sure to explain what and why you did all this. It shows that you are ‘in command’ of the information and hopefully convinces them that you know what you are doing.
- Once your data is clean and square, it is time to evaluate how your data is distributed and then normalize your data for your particular model. You must know how your data is distributed because any statistics you do on that data depends on it. The arithmetic mean of a log normal distribution is meaningless yet many environmental practitioners continue to present the mean as the middle value. There are many ways to normalize your data and you should likely normalize different ways for different statistical models or to analyze different things. For example, for pattern analysis of PCBs and PAHs, I find percent total normalization to be best in identifying patterns and clusters using hierarchical cluster analysis (HCA). Other normalization techniques include log normalization, …. As in point 1, you must communicate to your audience why you normalize the data before you do the modelling. What is the purpose of normalizing the data? I generally show principal component analysis (PCA) results with and without normalization or explain what the normalization technique is doing to the data to get their buy-in and what I am doing.
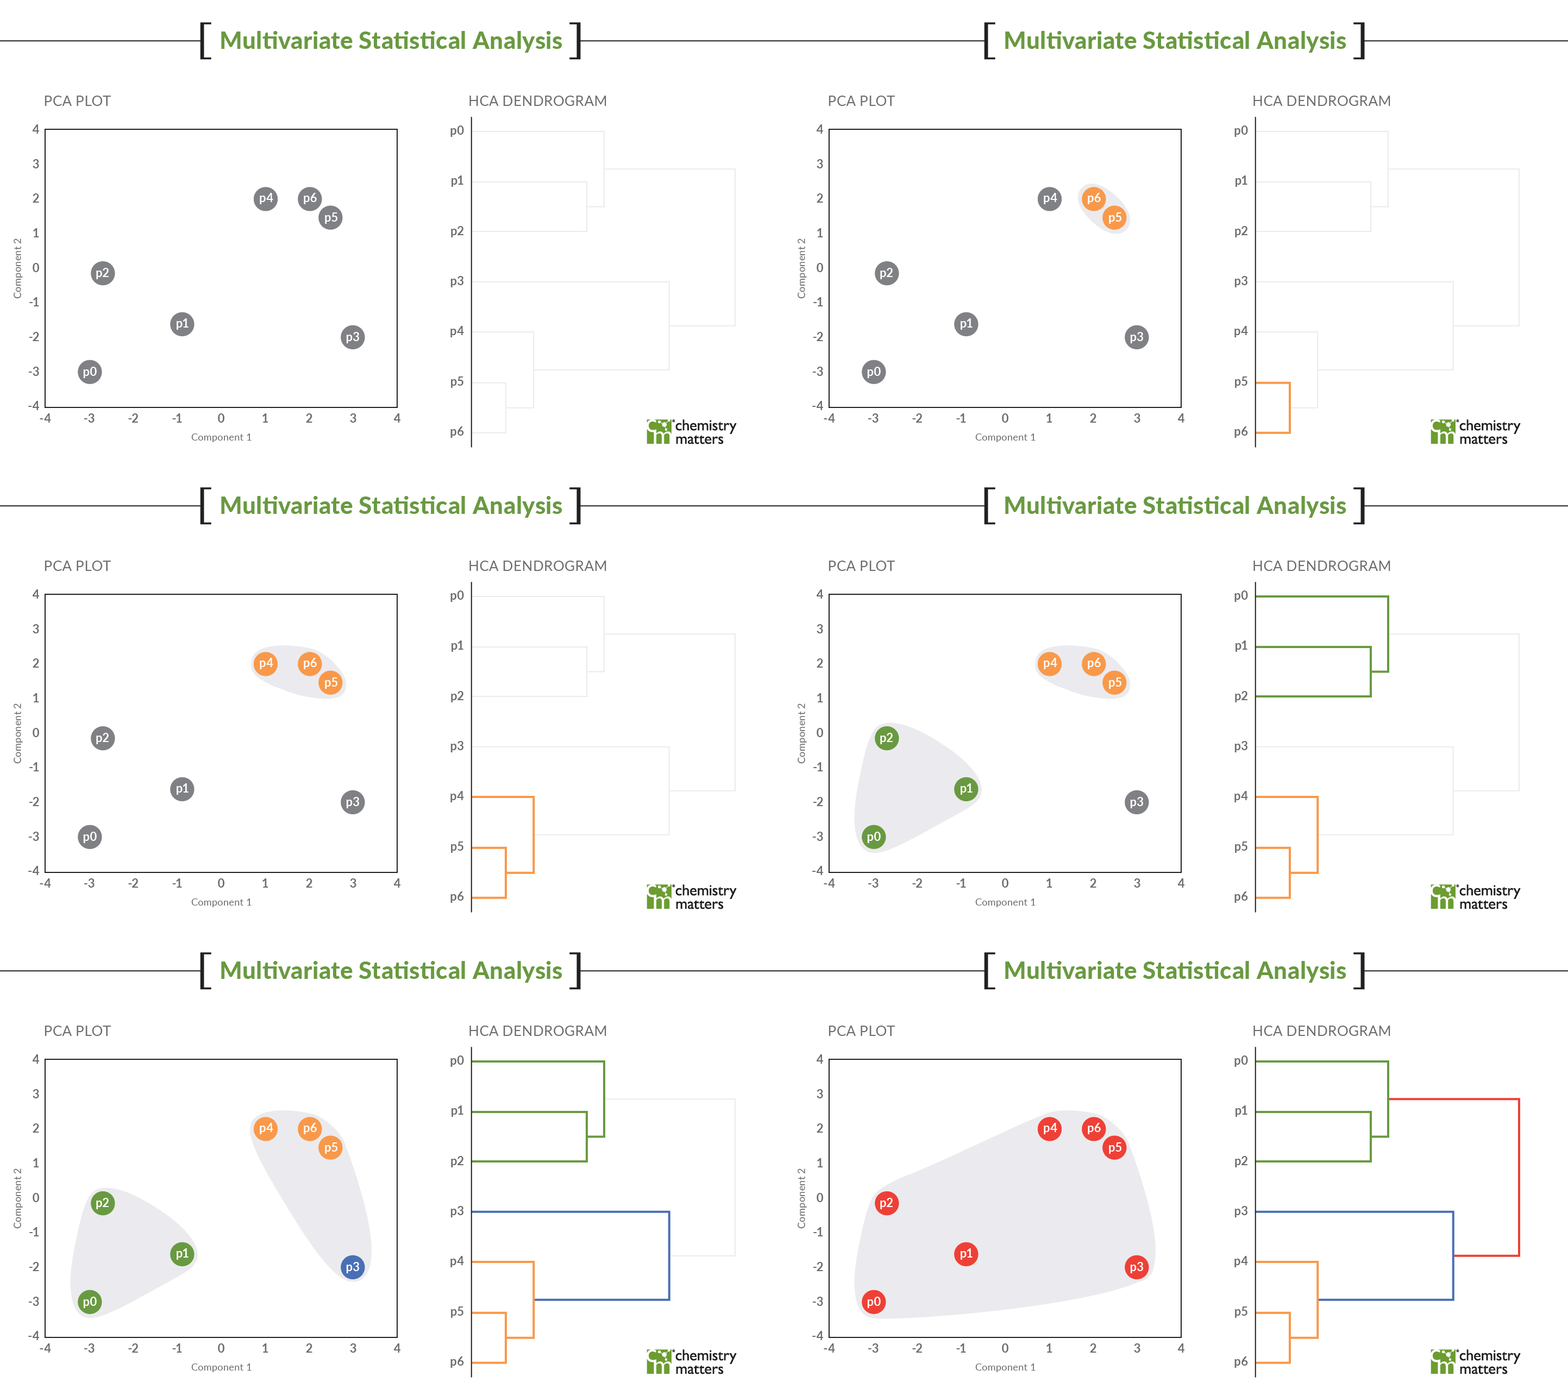
- The third thing is the modelling itself. It could be a PCA, an HCA or a receptor model but these models are NOT stand alone ‘Ta Da’ moments. Nobody that is unfamiliar with these models will look at a PCA plot and say, “Wow, I get it now!” Models are simply lines of evidence that need to be supported by other things. If you have different groupings on the PCA and those groupings match the HCA but then you can show the PAH fingerprint that matches those groupings, it can be a powerful visual that connects everything. If I can show that the PAH fingerprint (which is just the histogram plot of concentrations) are all the same for the samples in different clusters of the PCA/HCA, the model doubters start to believe that the model is actual working and providing insight. The same goes for geospatial analysis. If we can show that one side of the site under investigation groups different than the other side of the site using a map and PCA/HCA, they will believe the model because you used the map to help them. The data should ‘make sense’. I say this a lot with my cases, if the data isn’t all making sense, then you are likely missing something.
Modelling can be a powerful tool and if used right, can provide additional convincing lines of evidence for your casework. It is not the black arts that many people believe it to be. When science is misunderstood, it gets the power of magic. Models are not magic.
Welcome to our model Mondays blog! The last Monday of every month, we hope to be providing a blog regarding the use and presentation of models for your data visualizations of forensic chemistry and environmental forensic data.


