Chemistry Matters Inc. in conjunction with Statvis Analytics Inc. just hosted an invitation only event for select clients at Rodney's Oyster Bar this past week. The informal venue allowed great conversation along with the enjoyment of fish, seafood and raw oysters all while providing some informative science and future plans for where the two companies are going.
In addition to hosting everyone at the local restaurant, we also had a live webinar going for those that were too far to make it or could not make it in person. Other than a few technical glitches, it seemed to work very well.
We had great feedback from all those that attended online and in person
The event included 6 presentations.
The first presentation was by Lacey Harbicht who presented on how to identify natural salinity on your site using statistics and fingerprinting. This feature is now newly added to the data exploration component of Statvis. Salinity can drive the remediation costs of a site. Salinity drivers such as EC and SAR (electrical conductivity and sodium absorption ratio) can be poor for your site due to the natural conditions of the soil. This talk described how to identify those natural conditions then use them to modify the remedial guidelines to save money and will not put unimpacted soil in a landfill.
The second presentation by Court Sandau described some of the surprises that occurred on CMI projects in the past. The talk summarized the history of natural toluene in CMI projects and how CMI developed a method to unequivocally identify natural toluene at your site. This was published in a recent peer reviewed scientific paper . The talk went on to describe how muskeg and peat can generate not only natural toluene by also false positives for F3 which can cause soil exceedances of F3 in your field program. If you have a site with toluene and F3 exceedances and you are in peat or muskeg, DO NOT use Tier 1 guidelines. Modify the guidelines or remediation requirements by demonstrating natural sources. Again, will save money and will not put unimpacted soil in a landfill. Also, little known secret, when you are measuring PAHs in sediment, make sure you understand the background sources.
The third presentation by Lisa Kates discussed the use of advanced analytical techniques to help your investigations. Dr. Kates presented on the use of 2D-GC-TOFMS and 2D-GC-FID to help
solve arsonous wildfires, chemical fingerprinting of gasoline, condensate and most petroleum hydrocarbons mixtures using real case studies. 2D-GC has the ability to separate and characterize any complex mixture. Once you have the data, now the key is knowing what to do with it and how to use it. Ask us how!
The fourth and fifth presentations were by Paul Fuellbrandt and Khalid Lemzouji of Statvis Analytics Inc. Paul's presentation covered how Statvis works and how using Statvis techniques and the data that is likely currently available for your site will allow you to save remediation costs and get your sites to closure. In just 10 months, we have saved our clients over $7.5M in unnecessary remediation costs. The numbers speak for themselves. If you have a site that seems to be going no where fast and the remediation numbers seem high, give us a call and let us have a look. Khalid's presentation described the concept of Statvis and where we are going with the product. Simply said - you had to be there to get this insider information.
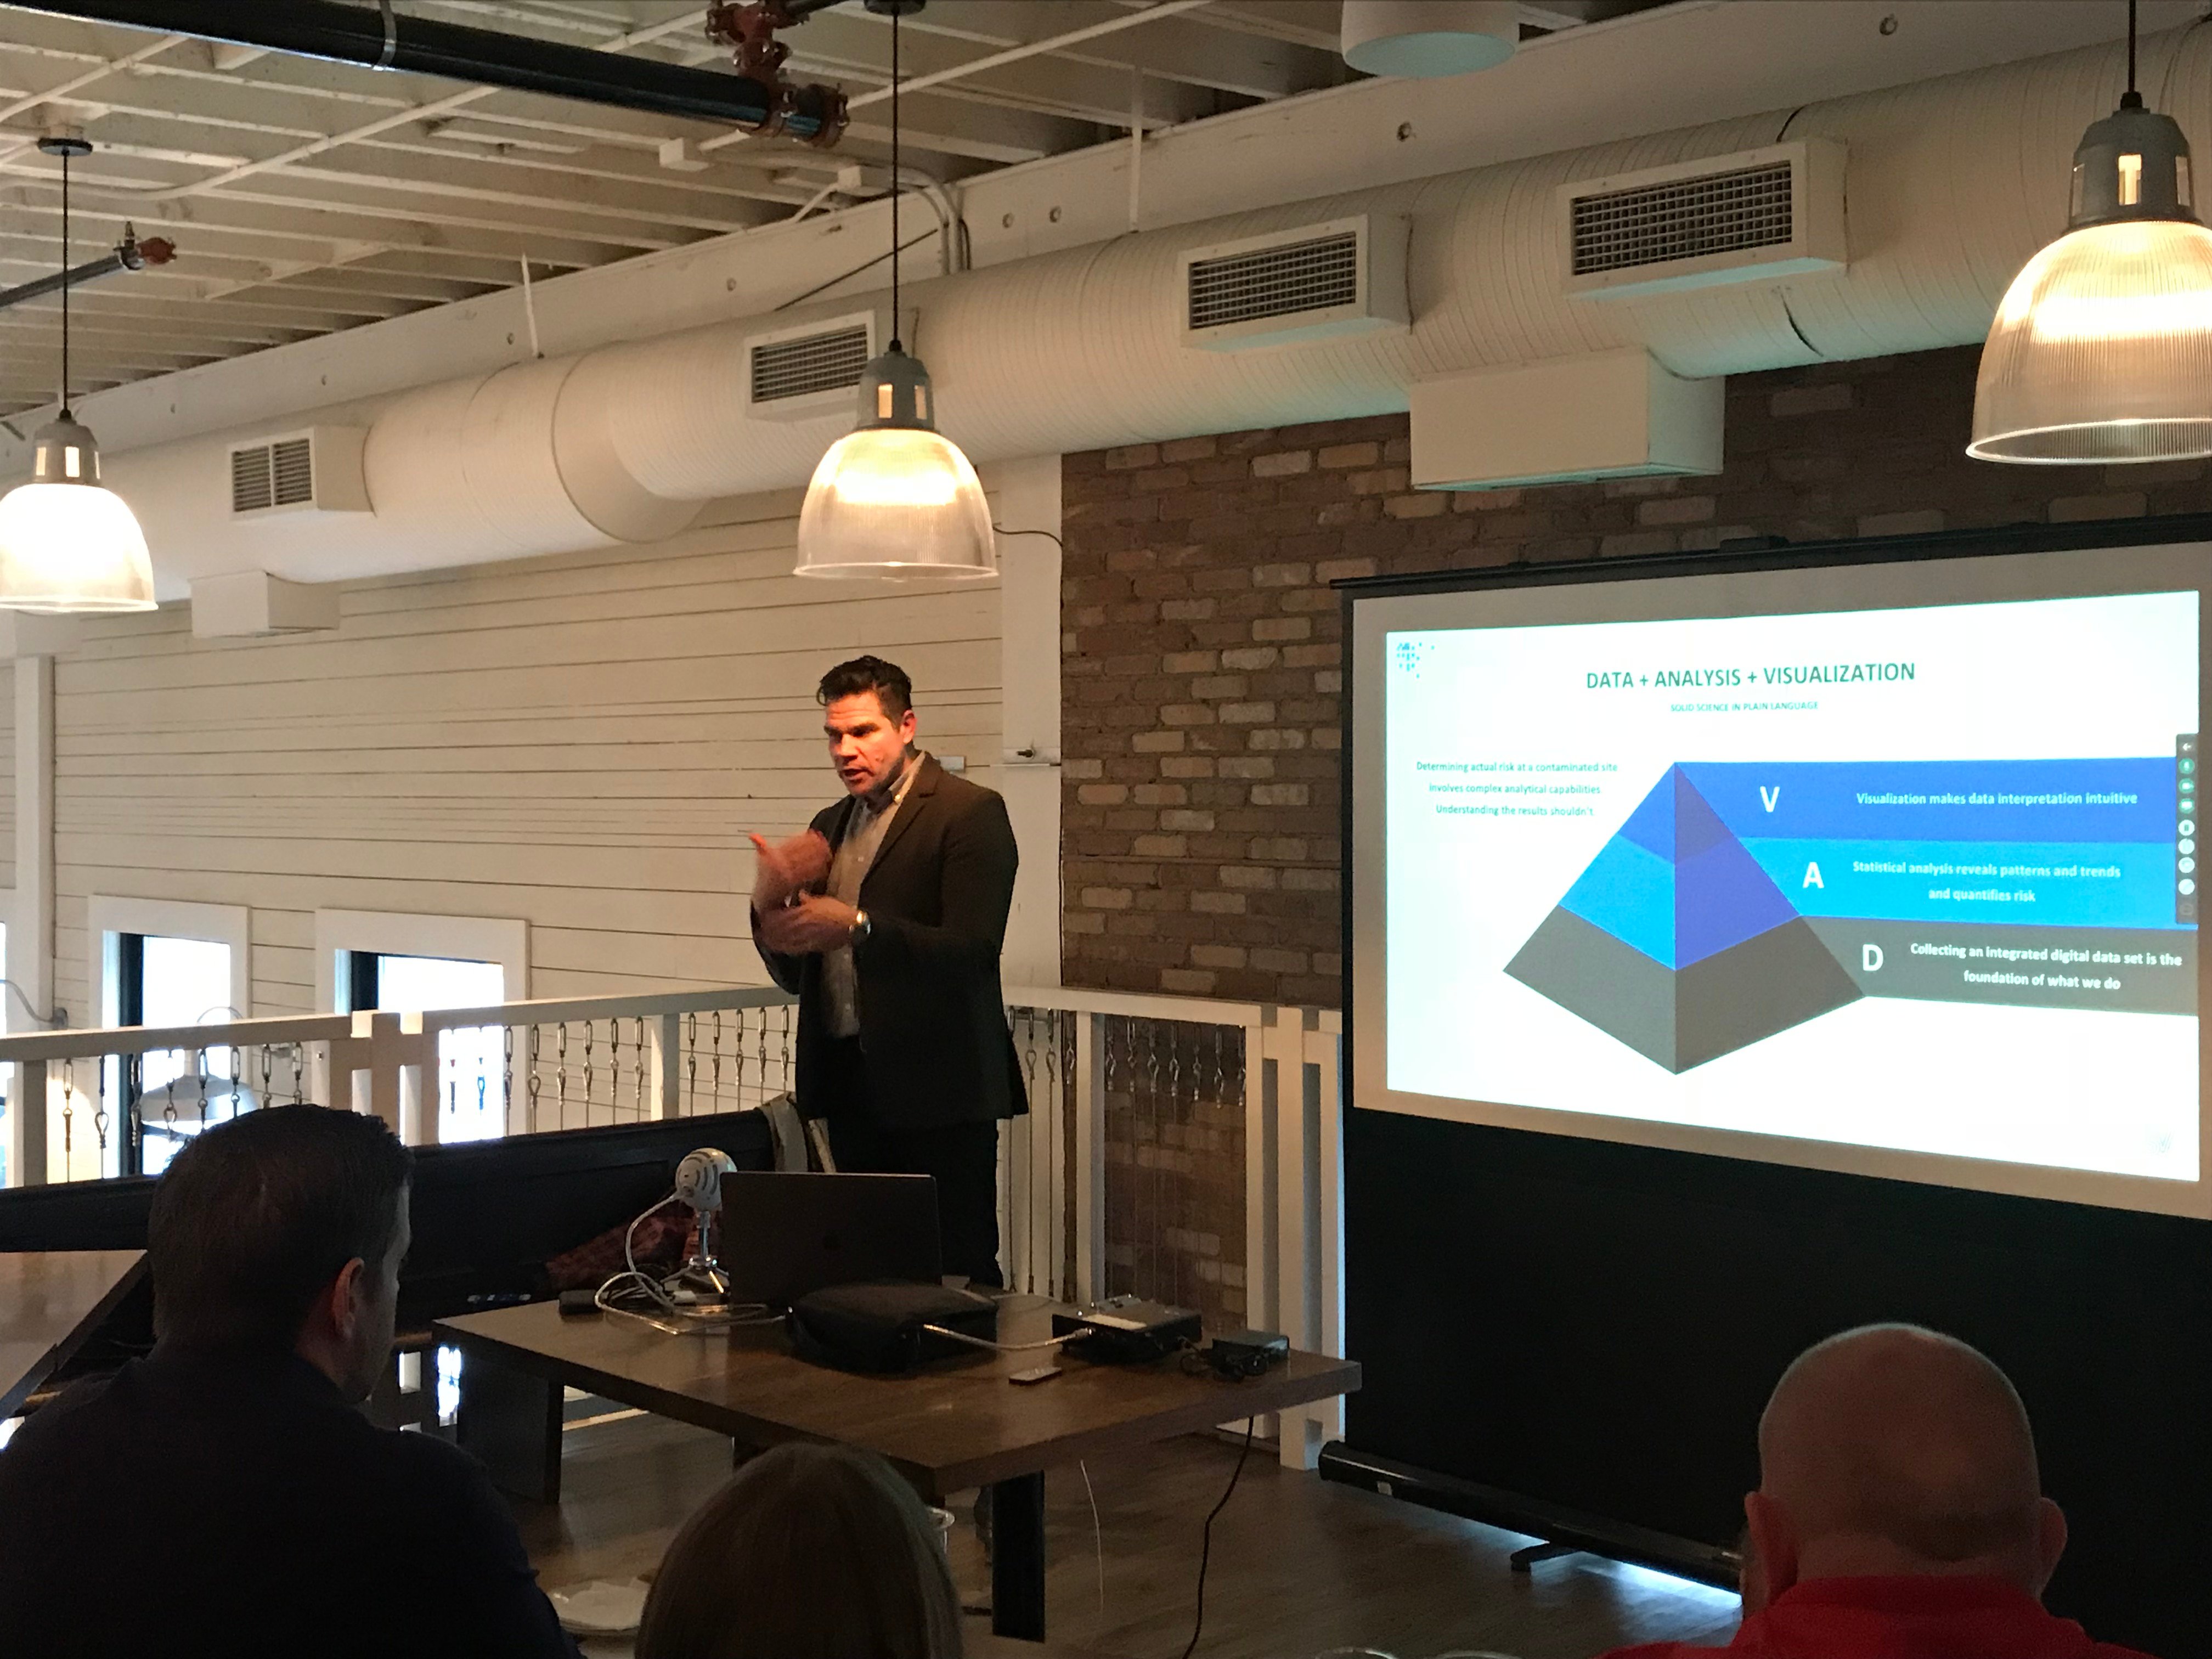
The last talk of the day was by Court Sandau. Big data is upon us, even in the environmental industry. All contamination has a pattern, find it! The key to many projects is using as much of the data as possible (unlock the data jail), understanding the contaminants and patterns (environmental forensics) and then communicating what that means for the site. Communication is key and it absolutely must be visual. The presentation demonstrated how a complex data set can be put through a visual data exploration tool to allow scientists to understand the data and then use that same tool to communicate the results with stakeholders. Interactive and visual communication of science.
The afternoon of oysters and science went over very well. We will definitely consider doing this again soon. Stay tuned to our social media channels and blog for upcoming events.

